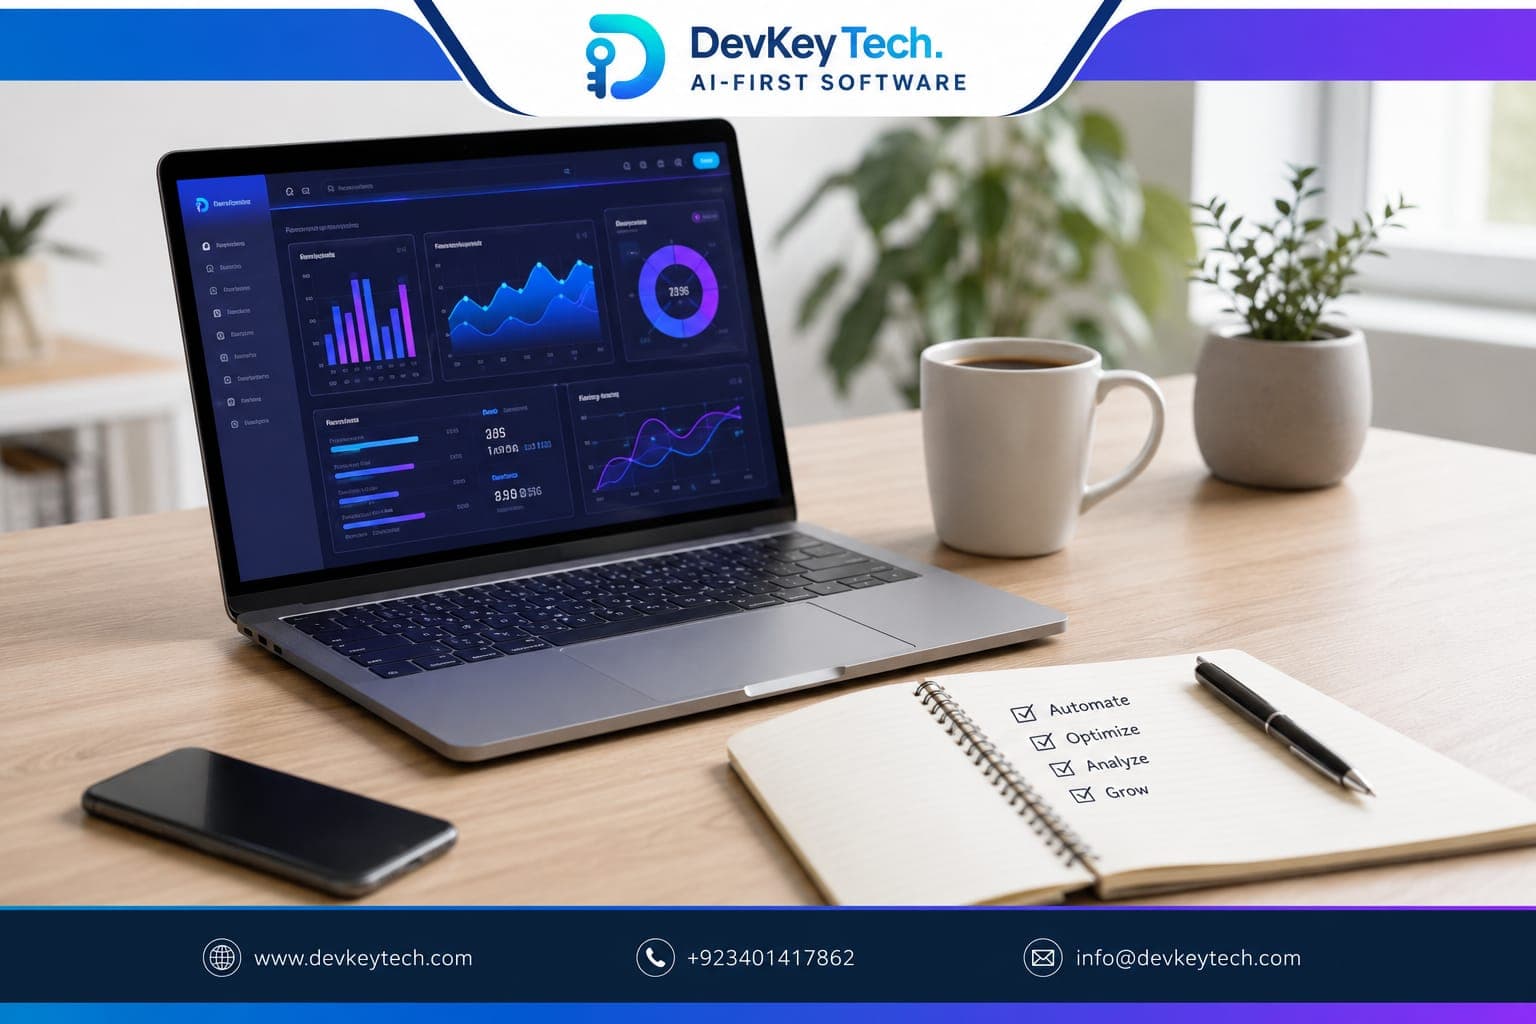
In today's fast-paced business world, data is abundant, but actionable insights often remain elusive. Raw operational data, while rich in information, can be overwhelming and inaccessible to teams without a deep technical background. This is where Business Intelligence (BI) dashboards become indispensable, acting as powerful interpreters that translate complex datasets into intuitive, visual narratives, empowering every team member to make data-driven decisions.
What Are Business Intelligence Dashboards?
At their core, a BI dashboard is a data visualization tool that displays key performance indicators (KPIs), metrics, and trends in an interactive and easy-to-understand format. Think of it as your business's control panel, offering a real-time, consolidated view of your most critical operational and strategic data points. Instead of sifting through spreadsheets or database queries, users can interact with charts, graphs, and tables to quickly grasp performance, identify patterns, and uncover opportunities or potential issues.
These dashboards are typically built using specialized BI software and can integrate data from various sources across an organization—from sales and marketing to finance and operations. Their primary purpose is to democratize data, making sophisticated analytics accessible to a broader audience than just data scientists or IT professionals.
From Raw Data to Actionable Insights
The journey from raw, disparate data to an actionable insight on a BI dashboard involves several crucial steps, each designed to refine and simplify the information for end-users.
Data Collection and Integration
The first step involves gathering data from all relevant sources. This could include CRM systems, ERP platforms, marketing automation tools, web analytics, financial ledgers, and even external market data. A robust BI solution integrates these diverse datasets into a unified view, often residing in a data warehouse or data lake. This foundational step ensures that decisions are based on a comprehensive picture, not isolated silos of information.
Data Transformation and Modeling
Once collected, raw data is rarely in a format suitable for direct analysis. It needs to be cleaned, transformed, and structured. This process involves:
- Cleaning: Removing errors, duplicates, and inconsistencies.
- Standardizing: Ensuring data from different sources follows the same formats and conventions.
- Aggregating: Summarizing detailed data into higher-level metrics relevant for analysis.
- Modeling: Structuring the data to facilitate efficient querying and reporting.
This behind-the-scenes work is critical for maintaining data integrity and ensuring that the insights derived are accurate and reliable.
Visual Storytelling
This is where the magic happens for non-technical users. Complex numerical data is translated into compelling visual representations. Dashboards leverage:
- Charts: Bar charts for comparisons, line charts for trends, pie charts for proportions.
- Graphs: Scatter plots for correlations, heatmaps for density.
- Tables: Summarized data for precise figures.
- Interactive Elements: Filters, drill-downs, and date range selectors that allow users to explore data dynamically.
The goal is to present data in a way that highlights key messages, identifies outliers, and reveals trends without requiring deep statistical knowledge. Effective visualization turns a mass of numbers into a clear story, guiding users toward understanding and action.
Empowering Non-Technical Teams
One of the greatest strengths of BI dashboards is their ability to empower individuals across various departments who may not have a background in data science or analytics.
Intuitive Interfaces
Modern BI dashboards are designed with user experience in mind. Their drag-and-drop interfaces, pre-built templates, and clear navigation make it easy for anyone to access and interpret information. This reduces the learning curve and encourages broader adoption within an organization.
Self-Service Analytics
Instead of relying on IT or a data analyst to generate a custom report for every query, BI dashboards enable self-service analytics. Users can apply filters, drill down into specific segments, and customize views to answer their own questions in real-time. This agility significantly speeds up the decision-making process and frees up technical resources for more complex tasks.
Focus on Key Performance Indicators (KPIs)
Dashboards are typically configured to highlight the most critical KPIs relevant to a specific team or business objective. A marketing team might track website traffic, conversion rates, and campaign ROI, while a sales team focuses on revenue, lead conversion, and average deal size. By presenting these crucial metrics front and center, dashboards ensure that teams are always aligned with their goals and can quickly identify areas needing attention.
BI dashboards democratize data, turning complex information into clear, actionable insights for everyone, not just data experts.
The Impact on Decision-Making
Implementing BI dashboards can profoundly transform how businesses operate, leading to more strategic, informed, and agile decision-making.
Faster, More Informed Decisions
With real-time access to accurate data, teams can react quickly to market changes, operational issues, or emerging opportunities. Gone are the days of waiting for weekly or monthly reports; insights are available instantly, allowing for rapid course correction or capitalization on fleeting trends.
Improved Operational Efficiency
By visualizing operational data, businesses can pinpoint bottlenecks, optimize resource allocation, and streamline processes. For example, a logistics dashboard might reveal inefficient routes, while a manufacturing dashboard could highlight equipment downtime, enabling proactive adjustments that reduce costs and improve productivity.
Enhanced Strategic Planning
BI dashboards provide a historical perspective and reveal long-term trends, which are invaluable for strategic planning. Leaders can identify growth areas, assess the effectiveness of past strategies, and forecast future performance with greater accuracy, leading to more robust business plans.
Proactive Problem Solving
Rather than reacting to problems after they've escalated, dashboards allow teams to monitor performance indicators that might signal an impending issue. Detecting a gradual drop in customer satisfaction scores or an unexpected spike in return rates early on enables teams to investigate and intervene before the problem becomes critical.
Key Considerations for Implementation
While the benefits are clear, successful BI dashboard implementation requires careful planning and execution.
Define Clear Objectives
Before building any dashboard, clearly define what questions it needs to answer and what decisions it should support. What KPIs are most important for your business? Who are the target users, and what information do they need to perform their roles effectively?
Choose the Right Tools
The market offers a wide array of BI tools, each with different strengths. Consider factors like scalability, integration capabilities, ease of use, and specific visualization needs. Partnering with experienced professionals who understand these nuances can be beneficial for selecting and implementing the best fit for your organization. Learn more about our approach to custom software development and data solutions by exploring our software development services.
Prioritize User Experience
A dashboard is only useful if people actually use it. Invest time in designing intuitive layouts, clear labels, and effective visualizations that resonate with your non-technical users. Gathering feedback during development is crucial for adoption.
Data Governance and Quality
The reliability of your dashboards hinges on the quality of your underlying data. Establish robust data governance policies to ensure data accuracy, consistency, and security across all integrated systems. "Garbage in, garbage out" is particularly true for BI.
Start Small, Scale Up
Don't try to build one massive dashboard that solves every problem. Start with a few focused dashboards addressing critical business needs. Once users gain confidence and demonstrate value, you can iteratively expand the scope and complexity.
Unlock Your Data's Full Potential
Business Intelligence dashboards are more than just pretty charts; they are strategic assets that translate the complexity of your operational data into clarity and actionable insight. By empowering every team—from sales and marketing to HR and finance—to understand and act on data, businesses can foster a culture of informed decision-making, drive efficiency, and achieve sustainable growth.
If your organization is grappling with data overload and seeking to transform raw information into a competitive advantage, consider how expertly designed BI dashboards can bridge that gap. Connect with us to discuss how custom data solutions can empower your teams.