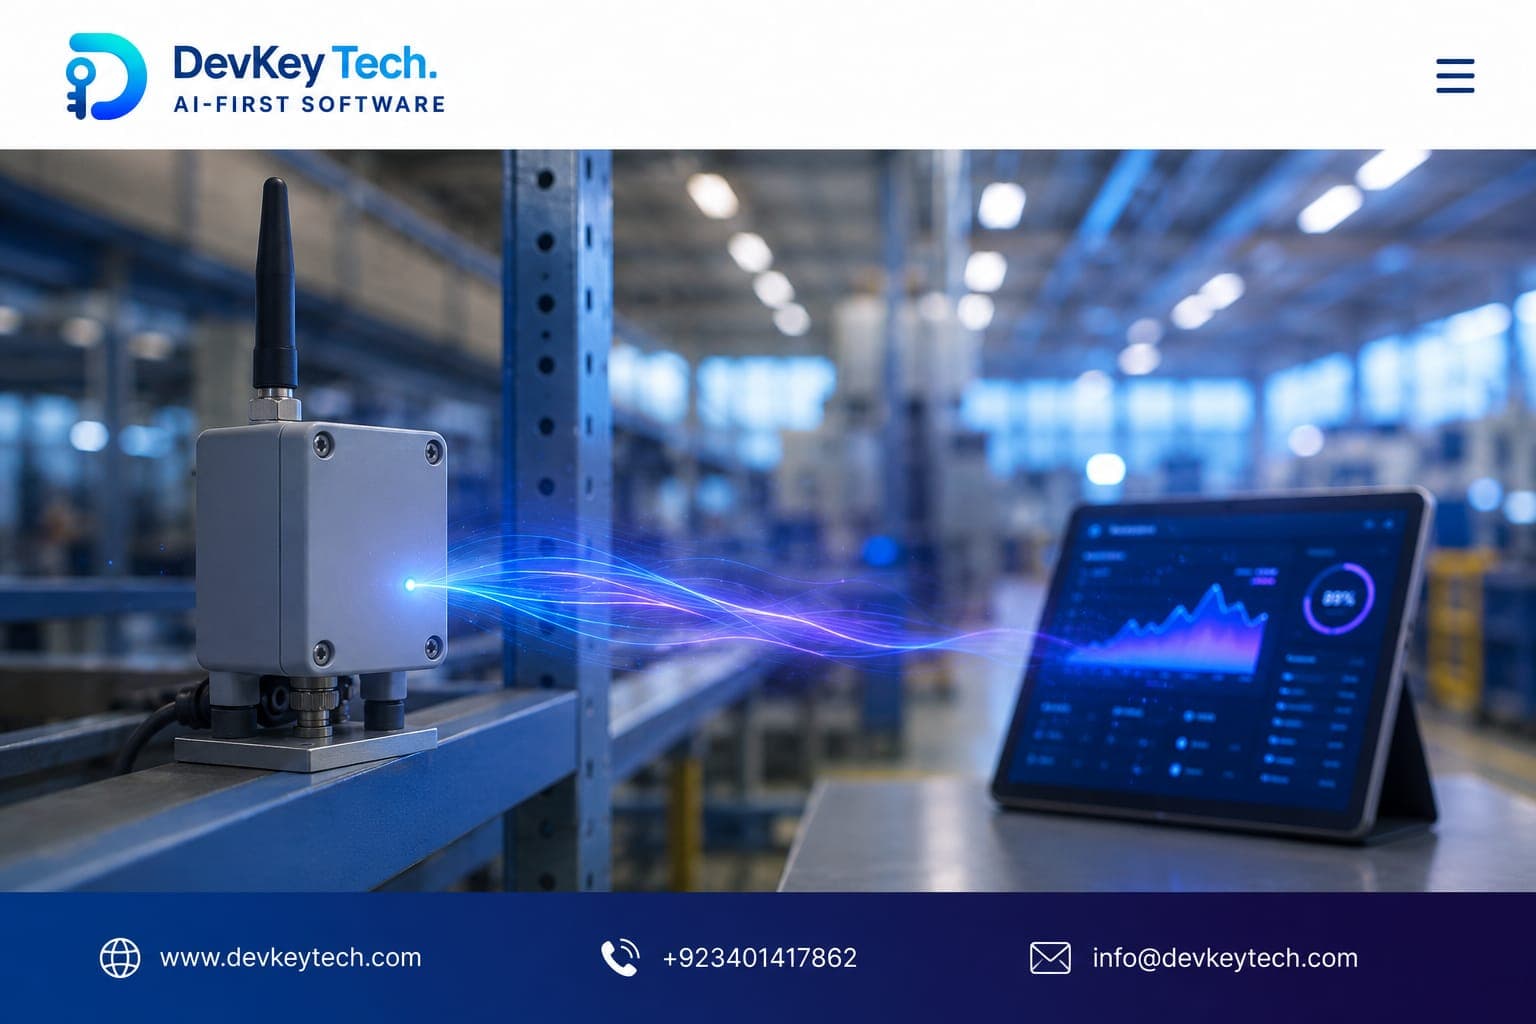
In our increasingly connected world, sensors are everywhere, collecting vast amounts of data—from the temperature in a smart home to the operational metrics of industrial machinery. But how does a simple electrical signal from a sensor translate into the insightful charts and graphs you see on a dashboard? The journey is complex, involving multiple stages of processing, transmission, storage, and analysis. Understanding this pipeline is crucial for anyone looking to build robust and reliable data-driven systems.
From Physical World to Digital Signal: Sensor Data Acquisition
The first step in any data pipeline is the sensor itself. These devices interact with the physical world, measuring parameters like temperature, pressure, light, humidity, or motion. Their primary function is to convert a physical phenomenon into an electrical signal.
- Analog Sensors: Many sensors produce an analog signal, a continuous electrical voltage or current that varies proportionally with the measured physical quantity. Examples include thermocouples (temperature) or strain gauges (pressure).
- Digital Sensors: Other sensors output a digital signal directly, often through protocols like I2C, SPI, or UART. These sensors typically include built-in analog-to-digital converters (ADCs) and may even perform basic calibration internally.
Regardless of output type, raw sensor data is often noisy and requires careful handling. Factors like sampling rate (how often data is read) and resolution (the precision of the measurement) are critical design considerations at this stage.
Edge Processing: The First Line of Defense
Once a sensor produces data, it often doesn't go straight to the cloud. Edge processing involves performing computation closer to the data source—at the "edge" of the network. This step is vital for several reasons:
- Reducing Latency: For real-time applications (e.g., industrial control, autonomous vehicles), immediate decisions are necessary. Processing at the edge avoids network delays.
- Conserving Bandwidth: Raw sensor data can be voluminous. Filtering out irrelevant data, aggregating multiple readings, or compressing data at the edge significantly reduces the amount of data transmitted over the network, saving costs and bandwidth.
- Minimizing Power Consumption: Sending less data means less energy used by the communication modules, critical for battery-powered devices.
- Enhancing Security: Sensitive data can be anonymized or aggregated before leaving the local network.
Common edge processing tasks include averaging multiple readings, applying simple filters (e.g., moving averages to smooth out noise), detecting thresholds, or triggering alerts based on local conditions.
Data Transmission: Bridging the Gap
After initial edge processing, the aggregated or filtered data needs to be sent to a central system for further analysis and storage. This transmission phase is highly dependent on the environment and requirements.
- Network Technologies:
- Wired: Ethernet is common for stationary, power-rich devices in controlled environments.
- Short-Range Wireless: Wi-Fi, Bluetooth, and Zigbee are popular for local area connectivity in smart homes or offices.
- Long-Range Wireless: Cellular (4G/5G), LoRaWAN, NB-IoT are used for wide-area deployments where devices are geographically dispersed and power-constrained.
- Communication Protocols:
- MQTT (Message Queuing Telemetry Transport): Lightweight, publish-subscribe protocol ideal for IoT devices with limited resources and unstable networks.
- HTTP/S: Widely used for web-based communication, robust for larger data payloads but can be less efficient for tiny, frequent updates.
- CoAP (Constrained Application Protocol): Similar to HTTP but optimized for constrained devices and networks.
Security during transmission is paramount. Encryption (e.g., TLS/SSL) and authentication mechanisms are essential to protect data integrity and confidentiality from the edge device to the central server.
Data Ingestion and Storage: Building the Foundation
Once data arrives at the central system (often a cloud platform or on-premise server farm), it needs to be efficiently ingested and stored. This stage is about handling the sheer volume and velocity of incoming data.
- Data Ingestion Services: Tools like Apache Kafka, AWS Kinesis, or Azure Event Hubs are designed to handle high-throughput, real-time data streams. They act as a buffer, decoupling data producers (your edge devices) from data consumers (your processing engines).
- Data Storage: The choice of storage depends on the data type, access patterns, and retention policies.
- Time-Series Databases (TSDBs): Optimized for storing and querying time-stamped data, like sensor readings. Examples include InfluxDB, TimescaleDB, or managed services like AWS Timestream.
- Object Storage: Services like AWS S3 or Azure Blob Storage are cost-effective for storing large volumes of raw, unstructured, or semi-structured data for long-term archival or batch processing.
- Relational Databases: Suitable for structured data where relationships between data points are crucial, though less common for raw sensor streams due to high write volumes.
A well-designed ingestion and storage layer ensures data durability, scalability, and accessibility for downstream processing.
Processing and Transformation: Unlocking Deeper Insights
This is where raw data begins its transformation into actionable insight. This stage often involves sophisticated data engineering and data science techniques.
Data Cleaning and Pre-processing
- Handling Missing Data: Imputation (filling missing values) or removal of incomplete records.
- Outlier Detection: Identifying and managing anomalous readings that could skew analysis.
- Normalization/Scaling: Standardizing data ranges for consistent processing, especially for machine learning.
Aggregation and Feature Engineering
Beyond simple averages, this involves creating new features or summarizing data in ways that reveal patterns. For example, instead of raw temperature readings, you might calculate the "rate of temperature change" or "average temperature over a 15-minute window."
def transform_sensor_data(raw_readings):
    # Example: Simple moving average to smooth noise
    window_size = 5
    smoothed_data = [
        sum(raw_readings[max(0, i-window_size+1):i+1]) / min(i+1, window_size)
        for i in range(len(raw_readings))
    ]

    # Example: Detect significant change
    significant_change_threshold = 2.0 # degrees per minute
    insights = []
    for i in range(1, len(smoothed_data)):
        if abs(smoothed_data[i] - smoothed_data[i-1]) > significant_change_threshold:
            insights.append(f"Significant change detected at index {i}: {smoothed_data[i-1]} -> {smoothed_data[i]}")

    return {"smoothed": smoothed_data, "insights": insights}
Advanced Analytics and Machine Learning
This stage can include:
- Anomaly Detection: Identifying unusual patterns that might indicate equipment failure or security breaches.
- Predictive Maintenance: Using historical data to forecast when equipment might need servicing.
- Root Cause Analysis: Correlating various sensor data points to understand why an event occurred.
This processing can happen in batch (on stored data) or in real-time (on streaming data), depending on the application's needs.
Visualization and Insights: The Dashboard View
The final step is to present the processed data in an understandable and actionable format. A dashboard is more than just a collection of charts; it's a window into the operational state of your system.
- Choosing the Right Visualization: Line charts for trends, bar charts for comparisons, heatmaps for density, and gauges for current status. The goal is clarity and immediate understanding.
- Dashboard Tools: Popular tools include Grafana, Microsoft Power BI, Tableau, or custom-built web applications tailored to specific user needs.
- Actionable Insights: A good dashboard doesn't just show data; it helps users make decisions. This might involve setting up alerts for critical thresholds, providing drill-down capabilities, or integrating with other operational systems.
- User Experience (UX): The dashboard must be intuitive, responsive, and provide relevant information at a glance, minimizing cognitive load for the end-user.
This is the point where the complex backend infrastructure truly delivers value, transforming raw sensor noise into meaningful business or operational intelligence.
Bringing It All Together
The journey from a sensor reading to a dashboard insight is a sophisticated orchestration of hardware, software, and networking. Each stage—from accurate sensor selection and intelligent edge processing to robust data transmission, scalable storage, sophisticated analytics, and intuitive visualization—plays a crucial role. Building such a system requires careful planning, expertise, and a deep understanding of trade-offs at every step.
At DevKey Technologies, we specialize in designing and implementing these complex data pipelines, helping businesses harness their sensor data to drive efficiency and innovation. If you're looking to turn your raw data into powerful insights, explore our software development services or get in touch with us to discuss your specific needs.